Name: Rickie van Berkum
Which came first in your life, the science or the art?
Science came first; I have always been fascinated by the ecological relationships between animals, plants, and the world around them. I pursued this interest through a PhD in Zoology and, afterwards, through rainforest conservation work. My love of knitting also started early but it is only recently that I began creating my own designs and considering the possibilities and constraints of hand-knits as an artistic medium.
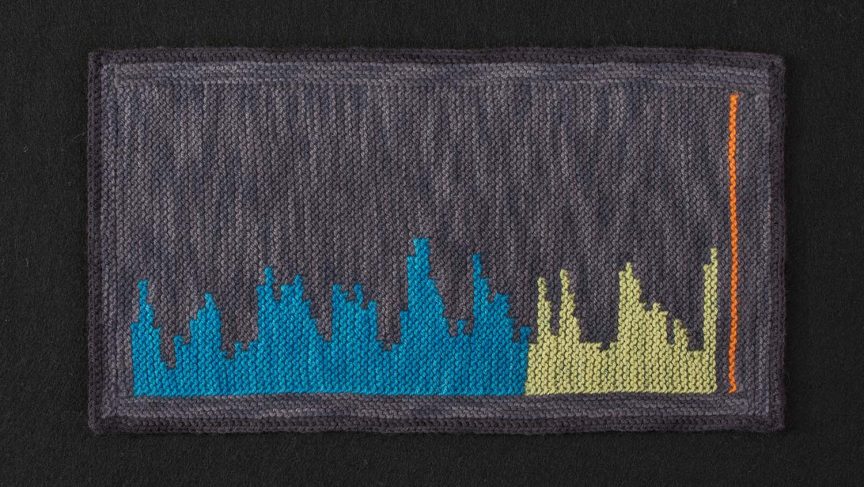
In 2017, I became concerned by the devaluation of science and data by our leadership and some of the public. I feel strongly that decisions at all levels are best made when relevant data are considered. My response was to develop a novel approach to telling the stories of science. I work with the tension between hard science and a traditional hand craft with familiar positive associations: hand-knitting.
“I became concerned by the devaluation of science and data by our leadership and some of the public. I feel strongly that decisions at all levels are best made when relevant data are considered.”
Rickie van Berkum
Which sciences relate to your art practice?
Much of my work involves climate science and social sciences, but I create pieces that show rigorous science in any field that affects our lives, including wildfire, gun safety, economics, and biodiversity. My challenge as an artist is to create pieces that are appealing and welcoming to non-scientists and scientists alike.
What materials do you use to create your artworks?
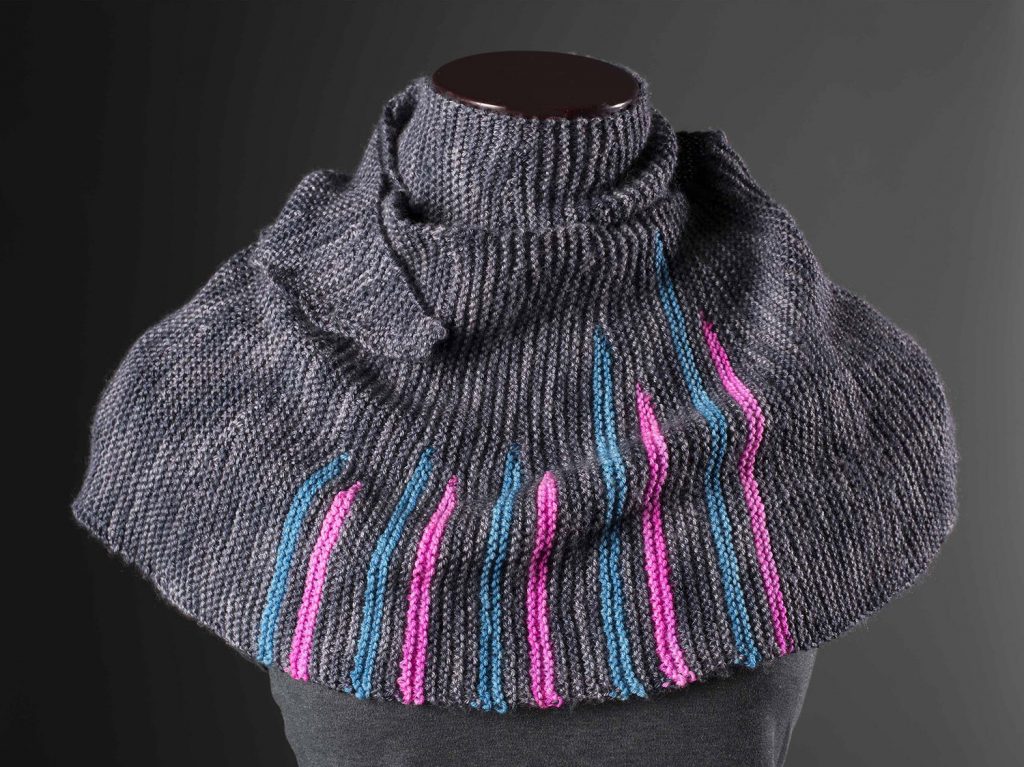
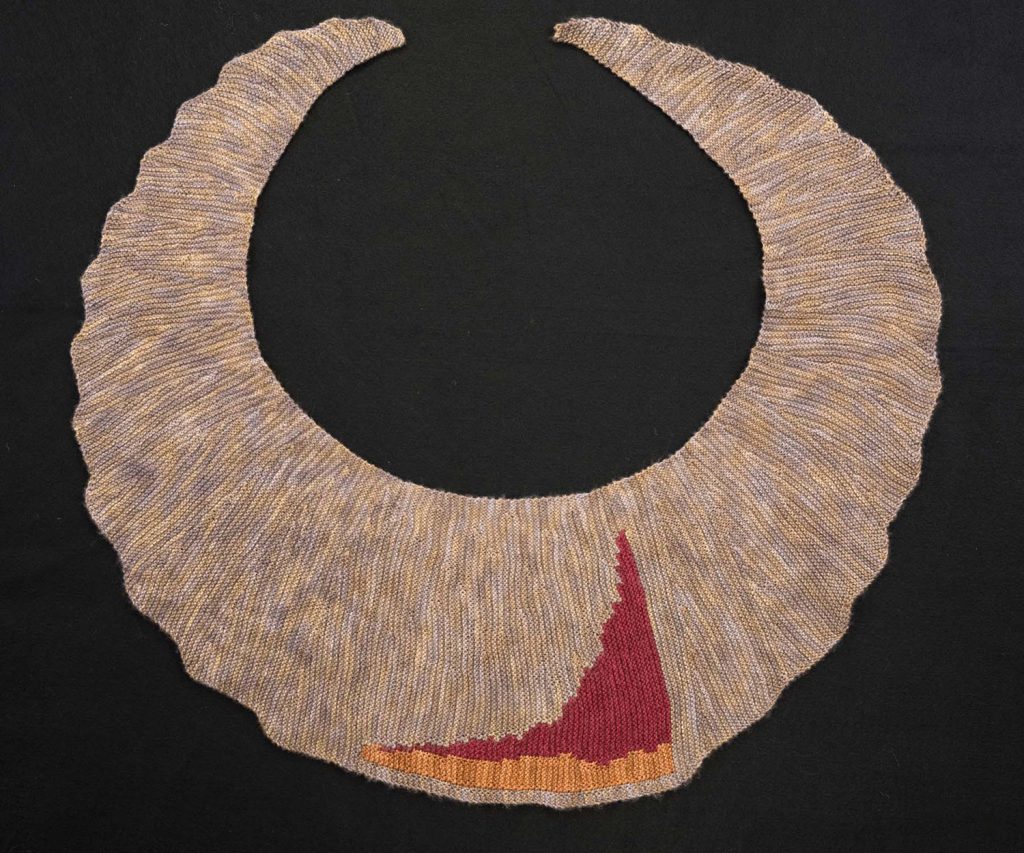
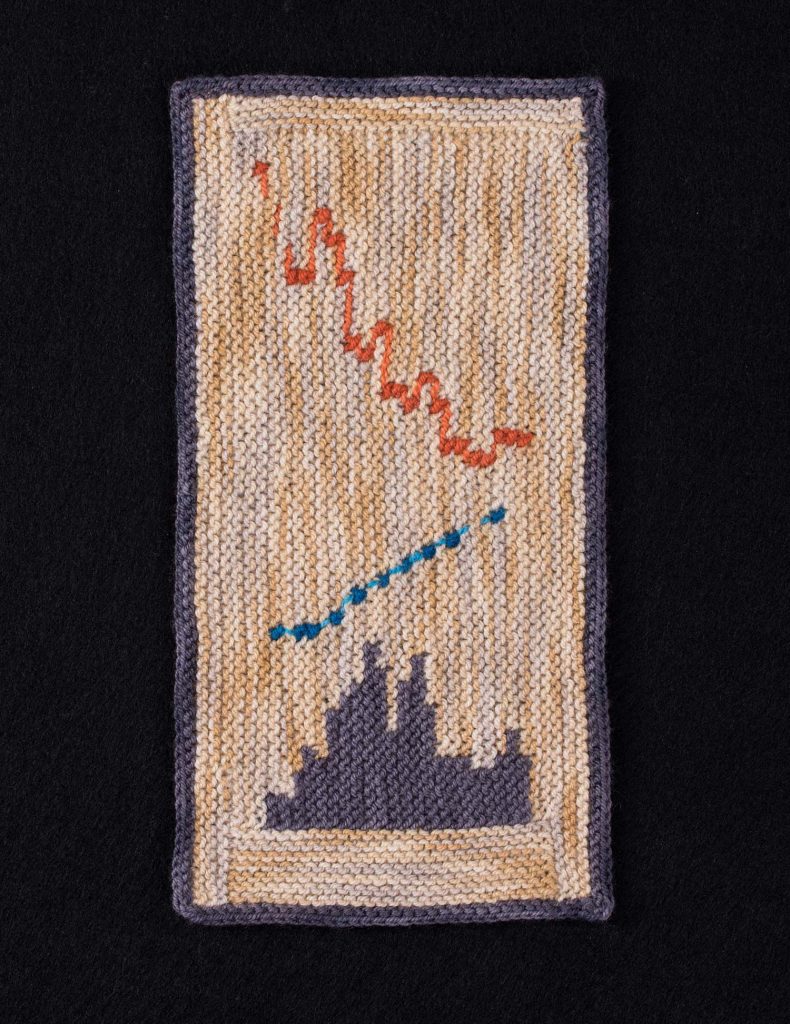
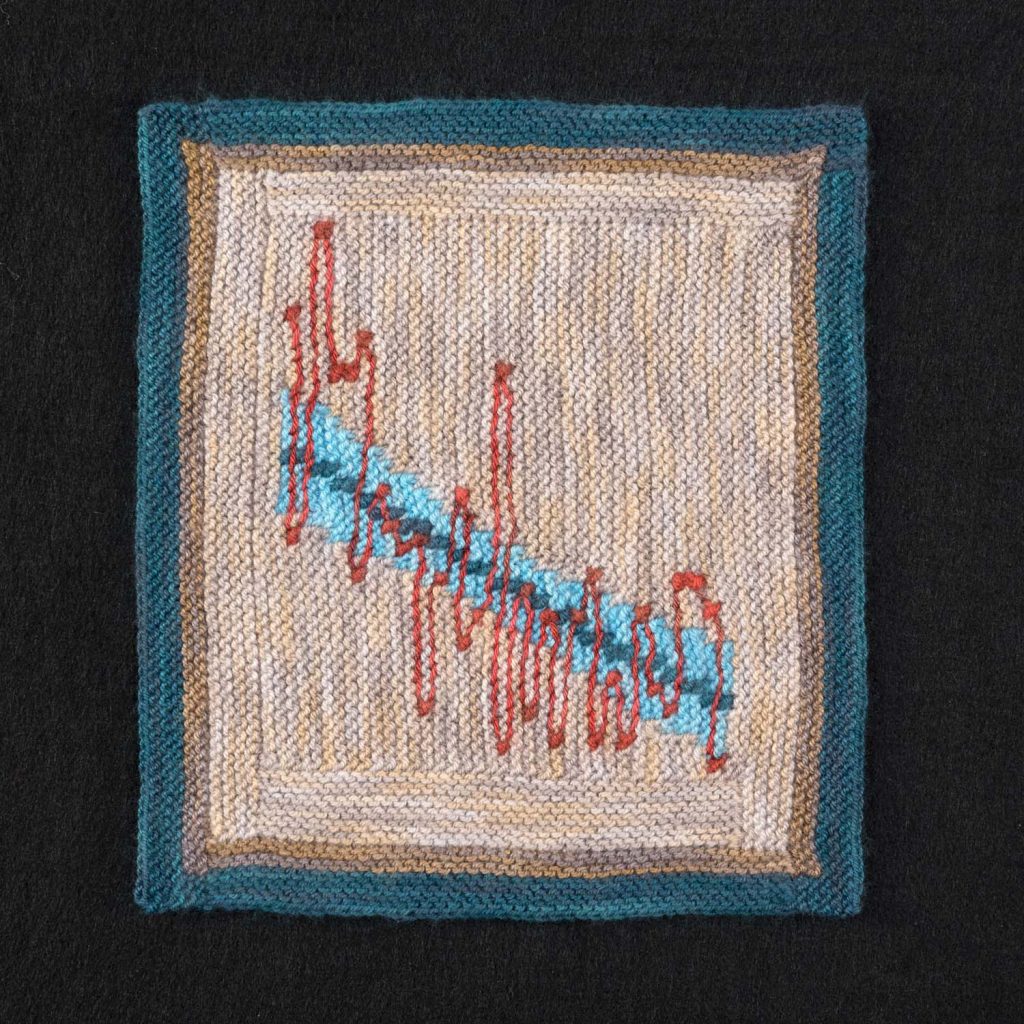
My artwork is created from yarn made from a blend of soft merino wool and silk, knit with wooden knitting needles. This yarn works up soft and cozy but with clear stitch definition. Colours show brightly on the yarn, enhanced by the hint of sheen from the silk. I dye my yarns using professional acid dyes. I like the juxtaposition of the comfort of the yarn and the rigor of the data that I’m presenting.
“I like the juxtaposition of the comfort of the yarn and the rigor of the data that I’m presenting.”
Rickie van Berkum
My trusty laptop and the internet are my tools for research and translating peer-reviewed data into knittable pieces.
Artwork/Exhibition you are most proud of:
I am most proud of pieces that encourage viewers to discuss the underlying science and consider how the data might impact their thinking. Some examples: Women in Corporate America, Gun Safety, Unintended Consequences, and Rich Man Poor Man.
Which scientists and/or artists inspire and/or have influenced you?
My graduate advisor, Dr. Raymond Huey, was a great model of the importance of telling the stories in science.
My work is about interpreting science by telling stories, and I am so inspired by science journalists who excel at this, especially Kendra Pierre-Louis, Flora Graham, who writes the Nature Briefing for Nature, and the editors of Science News.
Artists who have inspired me include fiber artists Kaffe Fassett and Kristin Nichols, along with painters Sandro Botticelli, Johannes Vermeer, Vincent van Gogh, Henri Matisse, Mark Rothko, and Helen Frankenthaler. My growth as an artist has been inspired by painters and friends Julie T. Chapman and Liz Chappie-Zoller.
Is there anything else you want to tell us?
I strive to present only the strongest and clearest science in my pieces. The research for my work includes reading the original peer-reviewed publications that present the data, and often consulting with other scientists and statisticians.
Find our more at Rickie van Berkum’s website, Facebook, or Instagram.
Share this Post