Name: Simón(e) Sun
Which came first in your life, the science or the art?
Art and science both came into my life at the same time. Though they were introduced to me as separate and distinct disciplines, they played similar roles in my early life. I was raised in an incredibly strict, conservative, religious household. Nonconformity was not only discouraged, it was met with punishment. This conflicted with my identity as a trans nonbinary woman when I did not yet have words or concepts to express my identity. Art and science became my refuge from the world of dogmatic religion. They allowed me to express and learn about myself and the universe in which I lived. Through this process, art and science became inseparable, neither dogmatic nor punishing, but ever-changing, ever-growing.
“[Art and science] allowed me to express and learn about myself and the universe in which I lived.”
Simón(e) Sun
Which sciences relate to your art practice?
Of the sciences, biology and neuroscience relate most strongly to my art practice. These sciences provide beautiful data through the study of life, body, and brain, and inspirational theories and ideas that enrich my love of conceptual art. Science is a beautiful dialogue between the material (data, subject of study) and the abstract (hypothesizing, experimental design, theory construction and validation). Conceptual art emphasizes a similar dialogue between material (the “artwork”) and abstract (the “idea”). This is one of the ways I find art and science very similar. In both disciplines, the practitioner’s job is to bridge the material and abstract domains to communicate a unified message to others. I find neuroscience particularly fascinating, as the material subject itself—a brain in a body—generates abstractions about the external world.
What materials do you use to create your artworks?
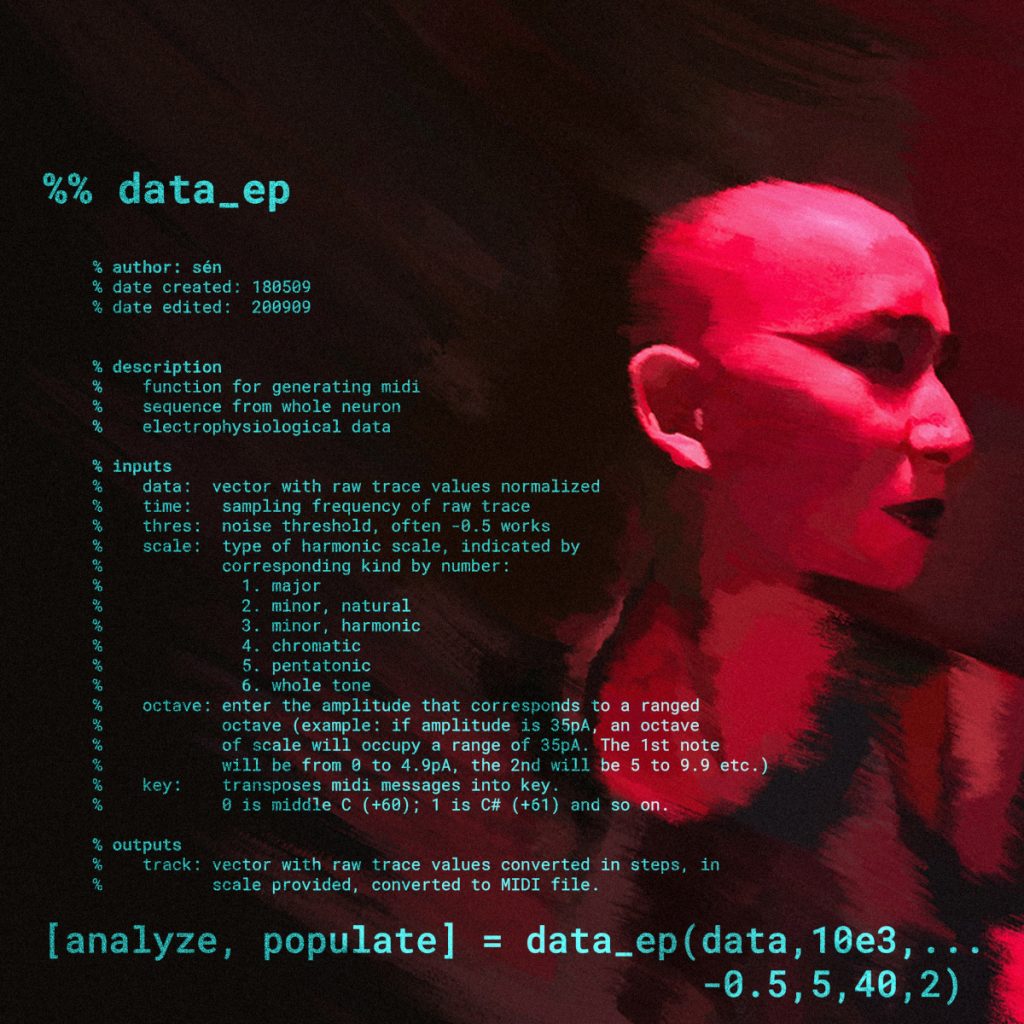
I use experimental data as the “raw material” for my artwork, whether it’s visual art or music. In each work, I attempt to balance “letting the data speak for itself” and “using the data to present an idea.” My illustrations are an example of this, but I can better describe my process through my forthcoming music album, Zero Divide Zero.
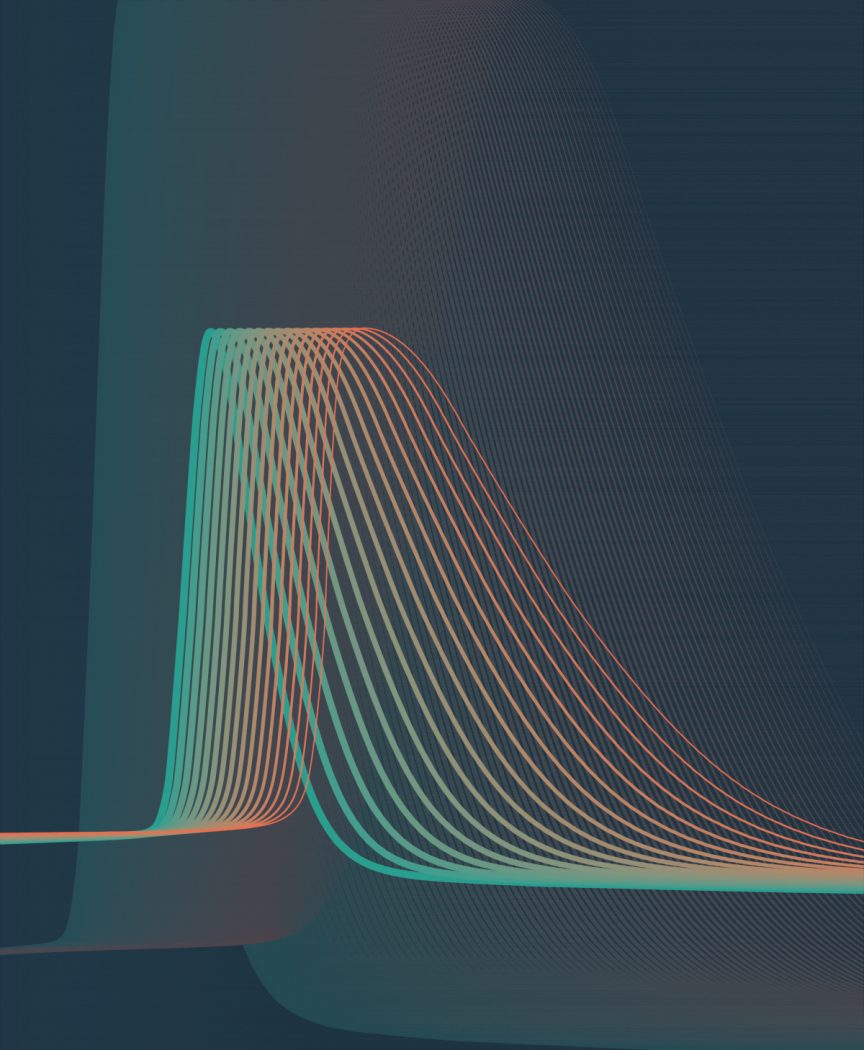
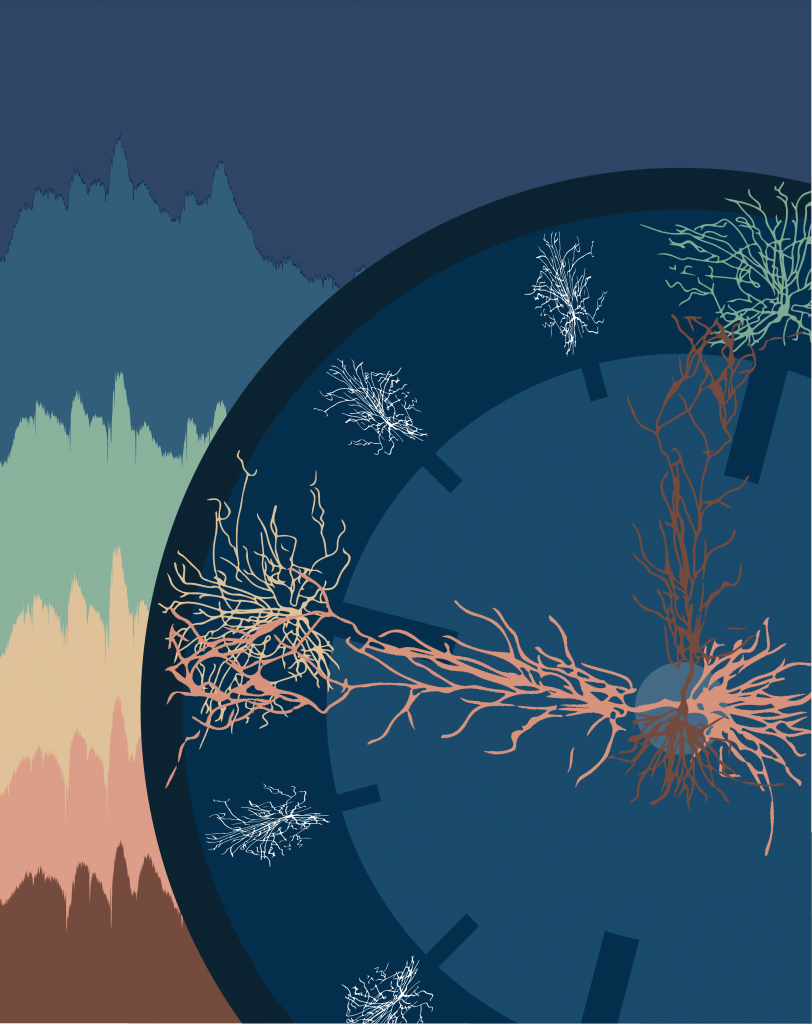
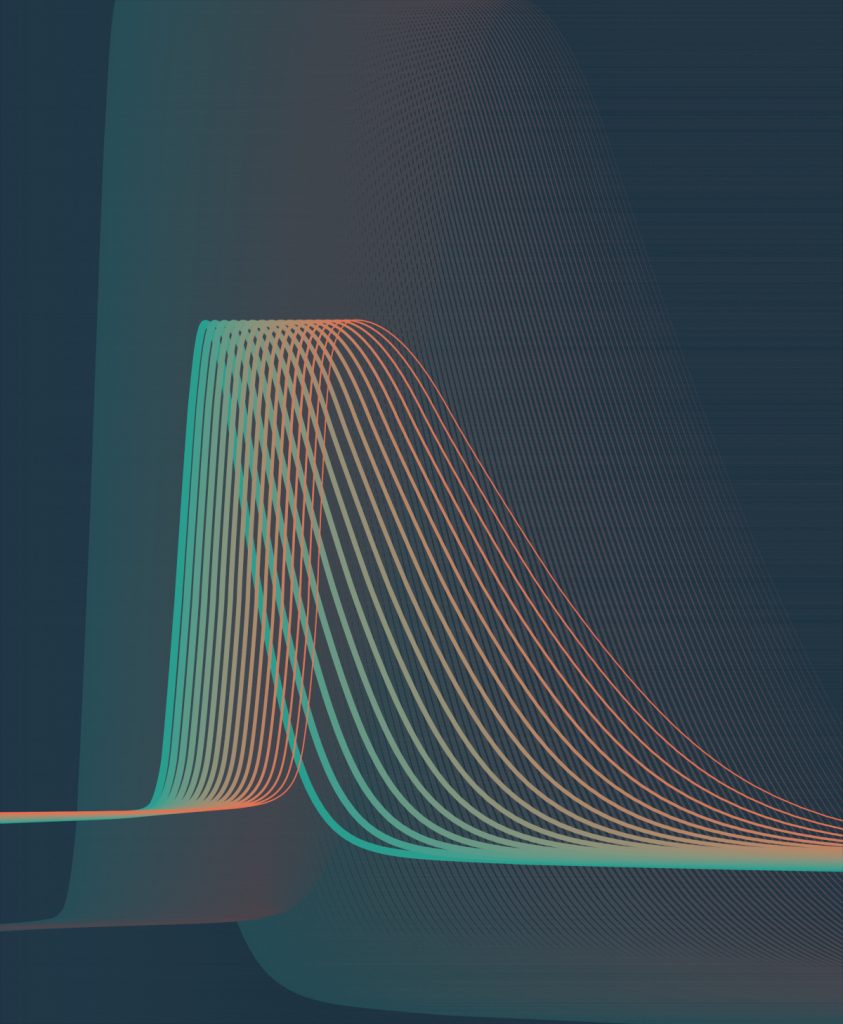
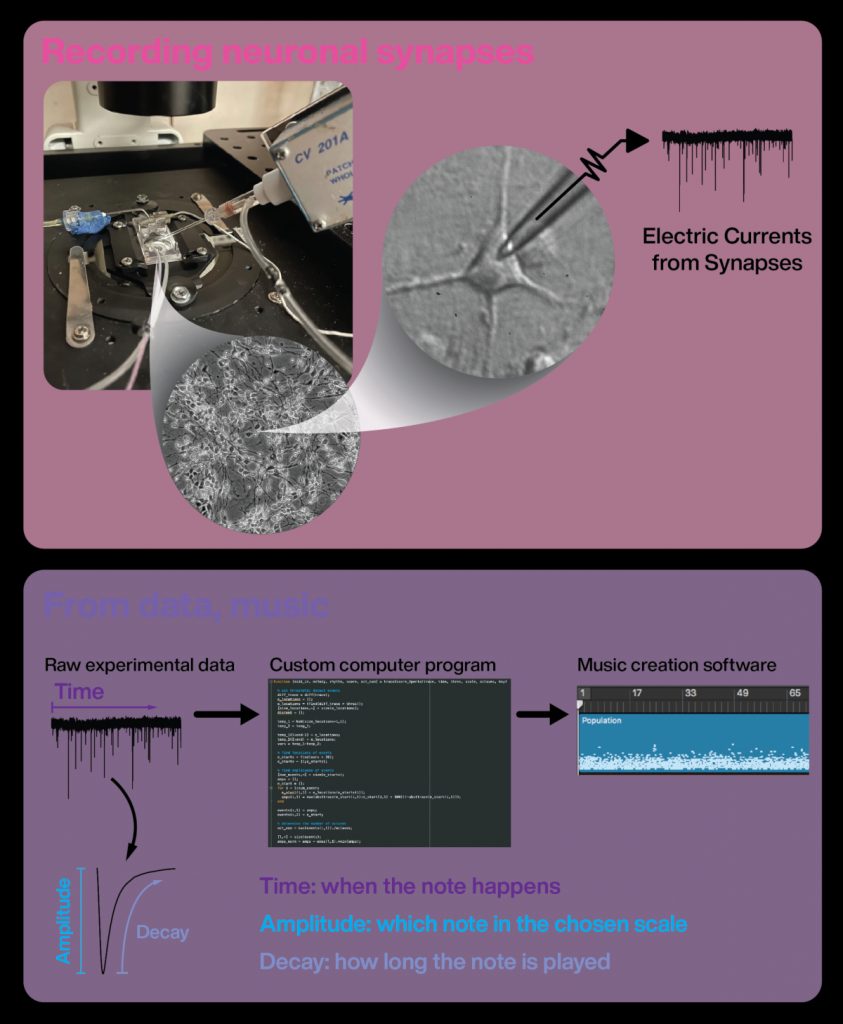
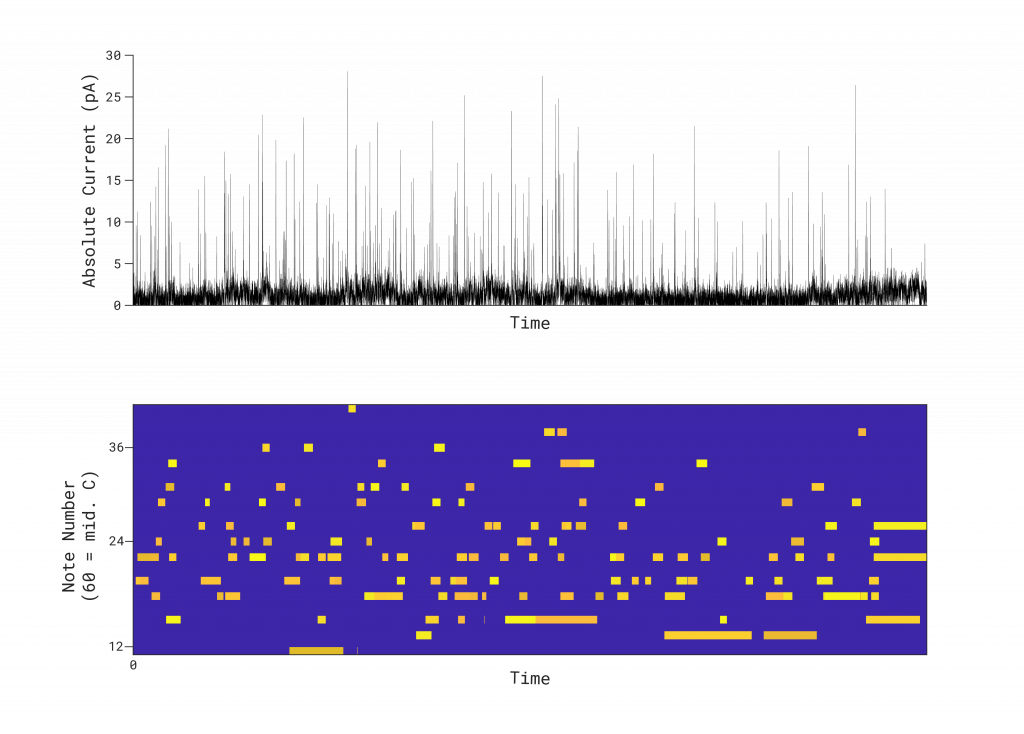
I study synaptic plasticity, which is the ability for synapses—connections between neurons—to change with new information. Scientists think that synaptic plasticity could be the biological substrate of learning and memory. In my experiments, I record electric currents from neurons called “miniature excitatory postsynaptic currents,” or “minis” for short. These minis are a way to measure the strength of a neuron’s synapses. The bigger the mini, the stronger the synapse. I created a computer program that converts three properties of minis, (1) when a mini happens, (2) its amplitude, (3) and its decay (see illustration), into a musical score. (1) Determines when a note is played. (2) Determines what note of the scale. (3) Determines how long the note is played. Afterward, I decide on instrumentation, rhythmic meter, and other music composition elements to compose these songs with the overarching goal of expressing the scientific method.
Artwork/Exhibition you are most proud of:
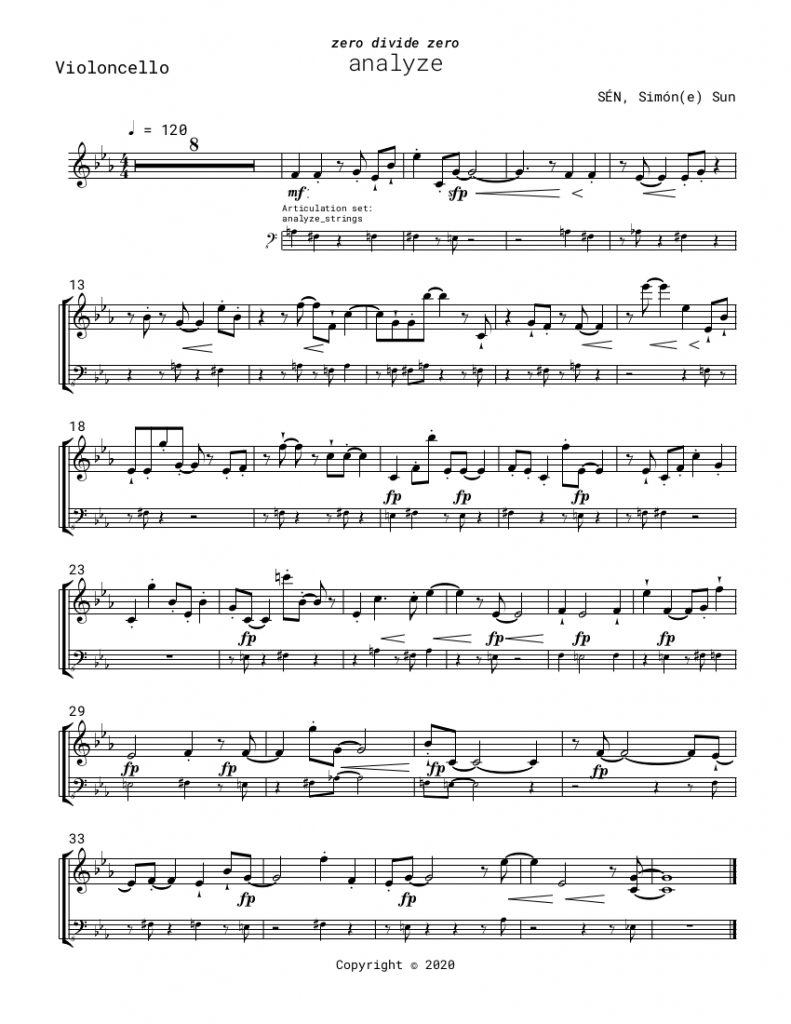
Right now, I am most proud of Analyze, a song I recently released on data_ep. In Analyze, I convey the act of data analysis using musical manipulations. The melody is made from a set of data that I converted into a melody using the process I described earlier. This data-melody is then manipulated—superimposed on itself, inverted, transposed, stretched and squished in time—in ways akin to data analysis. I think it’s my most successful attempt thus far at manifesting my ideas about the intersections of scientific and artistic processes. Analyze will be on Zero Divide Zero, along with the other data-based song on data_ep, Populate. I hope I’ll be as proud of Zero Divide Zero as I am of Analyze, when it’s finally released!
Which scientists and/or artists inspire and/or have influenced you?
Hodgkin, Huxley, and Flavin repeatedly inspire and influence both my scientific and artistic endeavors. Hodgkin and Huxley created a mathematical model that exquisitely describes how action potentials, electric spikes in neurons, initiate and propagate. Their combination of experimental and theoretical work achieves a level of scientific and artistic beauty I can only ever aspire to attain. Dan Flavin is known for his “paintings” with fluorescent lights. His work made me reconsider my assumptions about both art and science. His approach to the idea of “a canvas” and “a medium” catalyzed me to rethink the materials I use in my experiments practically and conceptually. His work also made me question the role of human perception in science itself. Thinking about how Flavin’s work changes with time and space is a reminder to me that “data” like any material doesn’t exist in a vacuum. It has a material/experimental context that shapes the way it is perceived and interpreted by humans, who each have their own contexts.

For more by Simón(e) Sun, visit her website, Twitter, Instagram, and artist pages on Spotify, Apple Music, and Tidal.
Share this Post